
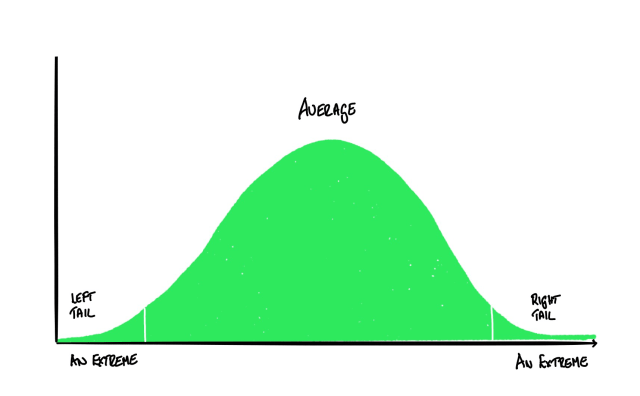
I am not average. Any part of me that is average is a fluke. Sheer chance. A statistical anomaly.
Some times a theme pops out during my reading and listening routine. I can’t get this one line out of my head, as heard on the Tim Ferris Show.
… extremes inform the mean, but not vice versa.
Dan Formosa, PhD
I have spent a large part of my career focusing on the middle of the curve. Making sure that what you deliver meets the needs of 80% of the users. When you need to change the scope, you trim at the edges. Your promise improvements in subsequent releases.
Like many of us, I do not know why I thought this way. This idea seems rational. I had never thought about it.
But then I came across this episode from the 99% Invisible Podcast titled On Average. This episode started to change my perspective.
So in 1926, when the Army designed its first airplane cockpit, they measured the physical dimensions of male pilots and calculated the average measurement of their height, weight, arm-length and other dimensions.
The results determined the size and shape of the seat, the distance to the pedals and the stick, and even the shape of the flight helmets. This mean that, in part, pilots were selected based on their ability to fit into the cockpit designed for the average 1920s man.
…
The high death rate in the Air Force was a mystery for many years, but after blaming the pilots and their training programs, the military finally realized that the cockpit itself was to blame, that it didn’t actually fit most pilots. At first, they assumed it was just too small and that the average man had grown since the 1920s, so in 1950, they asked researchers at Wright Air Force base in Ohio to calculate the new average.
One of these researches was a young Harvard graduate named Gilbert S. Daniels. In his research measuring thousands of airmen on a set of ten critical physical dimensions, Daniels realized that none of the pilots he measured was average on all ten dimensions. Not a single one. When he looked at just three dimensions, less than five percent were average. Daniels realized that by designing something for an average pilot, it was literally designed to fit nobody.
From 99% Invisible – On Average
Let me repeat that last sentence to make sure you understand where I am coming from: “Daniels realized that by designing something for an average pilot, it was literally designed to fit nobody.”
By designing for the middle of the curve, for the average, you end up with something sub-par. Barely good enough, and perhaps not used. Maybe the existing work-arounds remain in place.
Or, put another way by Patrick Collison the CEO of Stripe on the Ezra Klein Show:
As a society, I think we’ve generally tended towards trying to engineer lower variance, and that does successfully curtail the tails on the left, and all the downsides, but there are tails on the right too.
That quote was in response to a question from Ezra about regulation and regulators, and whether they are effective. The longer version is:
Patrick Collision: And so similarly, there are almost certainly services that are as valuable as Uber or AirBnB, that have been stifled, that don’t exist, but because kind of deeply, epistemically, we don’t know what they are, we sort of can’t be mad about it. And so I think this is the challenge with the regulations and the regulators. And it is not at all that I think they are short-sighted, or don’t care about this sort of thing, I think it’s just intrinsic in the nature of regulation.
And as a society, I think we’ve generally tended towards trying to engineer lower variance, and that does successfully curtail the tails on the left, and all the downsides, but there are tails on the right too.
By trying to look after the middle, to look after the average, the regulators may be managing the risks, but they could be preventing innovation at the other end of the curve.
This is the regulatory perspective, but I think it still holds. On a project we may be doing the same thing, trying to minimise the downside, the left tail, and end up missing the opportunities on the upside.
However, in my head I want to take this further. I think if you look at what both ends of the scale, if you design for the left and right tails, for the extremes, you could find some truly better options. And consequently end up with a better solution.
The extended extract from the earlier Tim Ferriss show episode, The Art and Science of Learning Anything Faster, make this point well.
In the documentary Objectified, Dan Formosa, PhD, then with Smart Design’s research department, explained one of the first steps in its innovation process:
“We have clients come to us and say, ‘Here is our average customer.’ For instance, ‘Female, she is 34 years old, she has 2.3 kids,’ and we listen politely and say, ‘Well, that’s great, but we don’t care . . . about that person.’ What we really need to do, to design, is look at the extremes. The weakest, or the person with arthritis, or the athlete, or the strongest, the fastest person, because if we understand what the extremes are, the middle will take care of itself.”
In other words, the extremes inform the mean, but not vice versa.
That “average user” can be deceptive or even meaningless, just as all averages ((Technically, arithmetic mean.)) can be. Here’s a statistician joke for your next hot date:
- Person A: What happens when Bill Gates walks into a bar of 55 people?
- Person B: I don’t know. What?
- Person A: The “average” net worth jumps to more than a billion dollars! ((Bill Gates’s estimated net worth as of March 2012 was $61 billion.))
– Tim Ferris in The Four Hour Chef and The 4-Hour Chef: Meta Sampler
Sometimes a quote sticks in your mind and you cannot get it out of your head. It starts to guide your thinking.
I started to review previous projects through this lens. Suddenly compromises that made sense, just didn’t anymore. Sure this was not always true.
There were decisions made by taking an idea from the edge cases. There are times where I have pushed the boundaries of what the users think is normal. But always with the expectation that by the time we compromised the solution would still be better. And this is what “informing the mean” means. When you push at the edge, you improve the middle. You shift the curve to the right.
Read that last paragraph again. Did you spot it?
Hidden in that paragraph is a bias for the better end of the scale. For the right tail.
What about the left tail? What about the other end of the spectrum, with the users who struggle?
We should be designing for that end of the tail too. See the quote below from a Kumu guide.
“When you speak with and observe extreme users, their needs are amplified and their work-arounds are often more notable.”
– d.school
Kumu-Finding-Clarity-Using-interviews-to-listen-to-a-system.pdf
If a user on the left end of the scale is struggling, there is an indicator, a work-around, you can use to inform your solution. What you build has to work for them too.
Ask yourself why they do it that way? Why do they find that way easier?
There is opportunity there.
So, pay attention to the edges, to the tails, and to the extremes. When you focus on these areas, your solution will take care of the middle.
This is what I plan to do from now on. Pay a disproportionate attention to the edge cases, to the left and right of the curve. That is where the gems are.
I have a couple of quotes that bounce around in my head, for example “Show Early, Show Often“, “Luck is where Preparation and Opportunity meet” (Seneca), and “It’s not what the vision is, it’s what the vision does” (Robert Fritz).
Now I have one more “The Extremes inform the mean, but not vice versa” (Dan Formosa).
